1. Program ManagerPrograms give you a bird's eye view of work across multiple projects in Jira representing your overall initiatives. By configuring your program to use information contained in a single or multiple projects, it can provide you an overview of how individual teams are tracking towards your initiatives. 1.1 Create a new ProgramYou can create a whole new program or create a new program from an existing program. 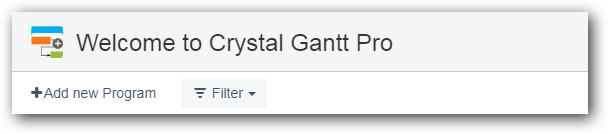
1.1.1 Creating New Program from scratch- Click on Add new Program on top of the home page.
- Choose Create a new Program and click on Next.
- Enter Program Name, Program Leader, Start Date and End Date in the Program Configuration dialog that appears and click on Next.
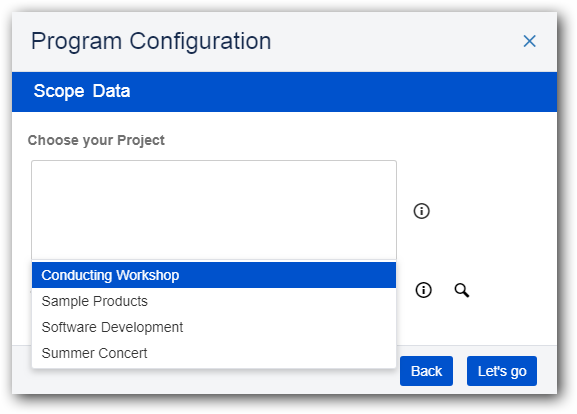
- Choose your Project(s) for based on which you want to create the program.
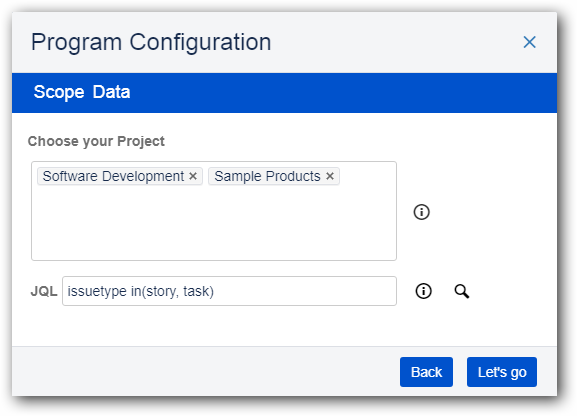
- Optionally, you can choose to filter the tasks that will be included in the Program using a JQL (JIRA Query Language). Then click on Let's go.
Now, the program is created. 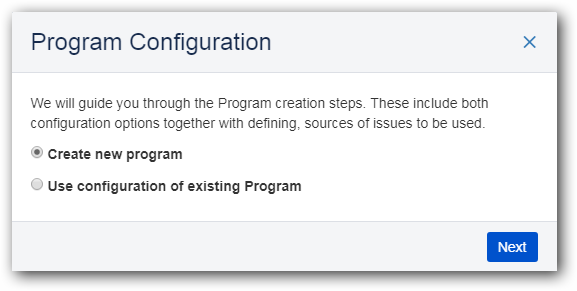

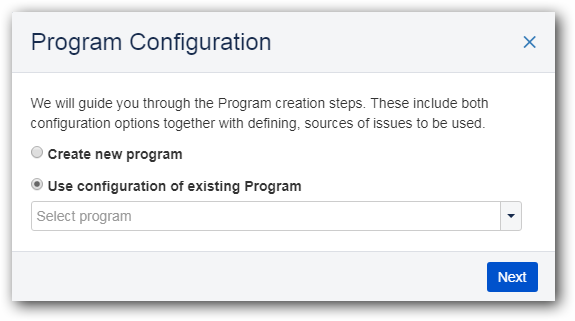
1.1.2 Using the configuration of an existing programClick on Add new Program on top of the home page. - Choose Use configuration of existing Program and then select any existing program from drop-down and then choose Next.
- Enter Program Name, Program Leader, Start Date and End Date in the Program Configuration dialog that appears and click on Next.
- Choose your Project(s) for based on which you want to create the program.
- Optionally, you can choose to filter the tasks that will be included in the Program using a JQL (JIRA Query Language). Then click on Let's go.
1.2 Gantt ConfigurationAbility to customize the Jira fields that the Gantt binds to and the look and feel and behavior of the Gantt. 
On clicking the icon, you get redirected to a new page where you can configure the "Gantt Data Settings" and also the "Gantt UI Settings". This is discussed in more detail here: UI Configurations. 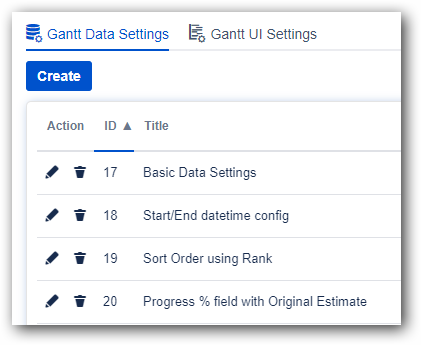 Image Added Image Added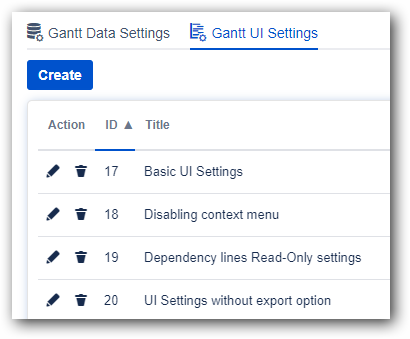 Image Removed Image Removed
You can then apply one of these settings to the Program that you define. 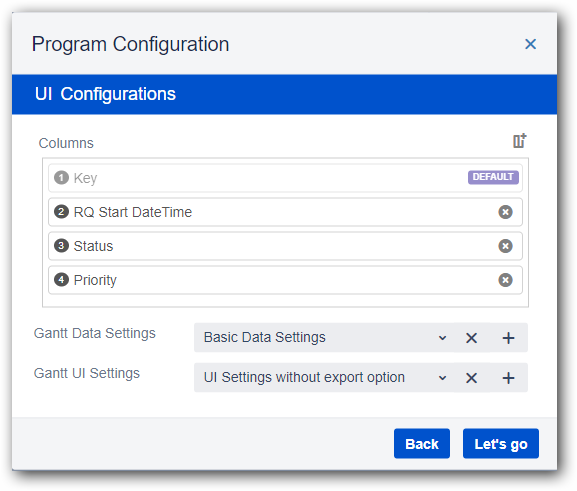
1.3 Documentation and Feedback1.3.1 Documentation Refer to our Crystal Gantt Pro documentation by clicking the documentation icon. 
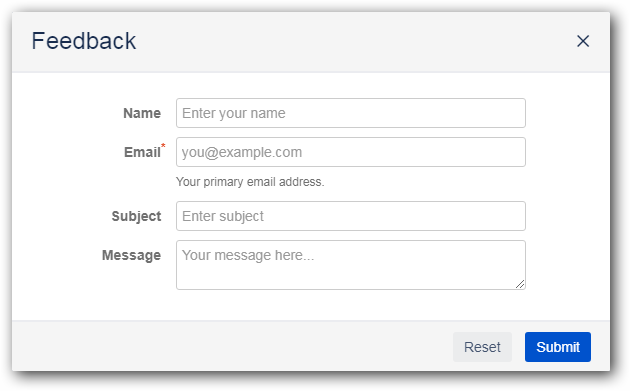
1.3.2 Feedback Send your valuable feedback to us which will be helpful to improve our product by clicking the feedback icon. 
1.4 Editing a ProgramClick on Edit Program Details icon to edit the created Program. You can edit Program Name, Program Leader, Start Date and End Date in the Edit Program Configuration dialog as shown below. 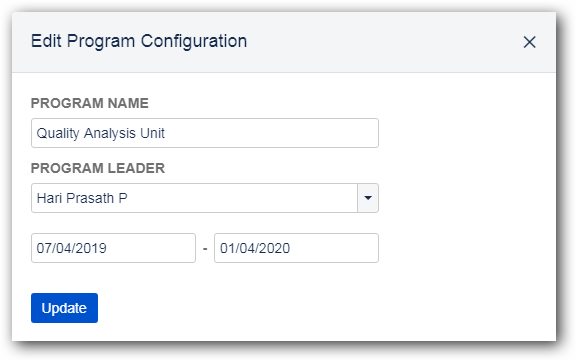
1.5 Deleting a ProgramClick on Delete Program icon on the right to delete the program you created. 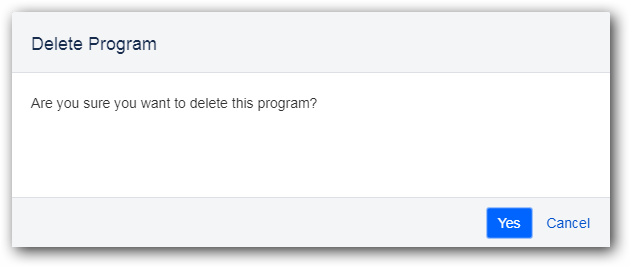
1.6 Filtering the Programs View1.6.1 Filter by DropdownYou can filter the programs by selecting either All Programs or My Programs from the Filter dropdown. 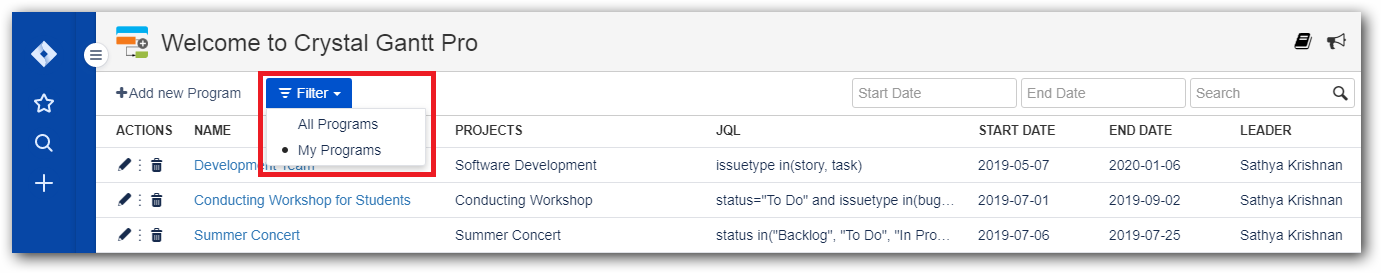
1.6.2 Filter by DatesSelect start and end range using date picker to filter programs which has started/ended within that range. 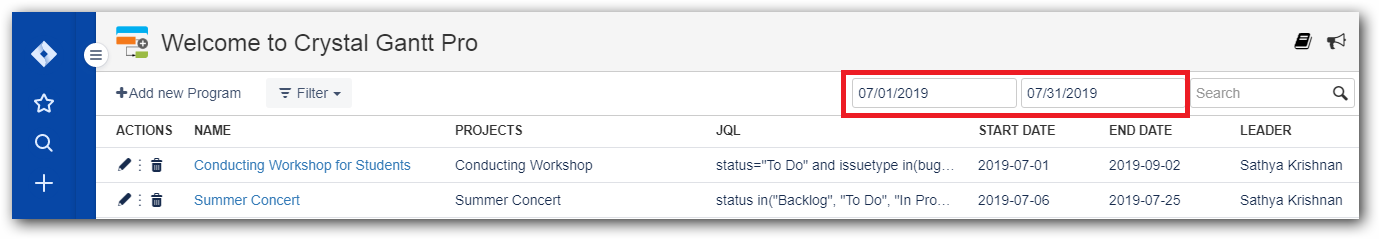
1.6.3 Filter by Program NameAllows you to search for Programs by the Program Name. 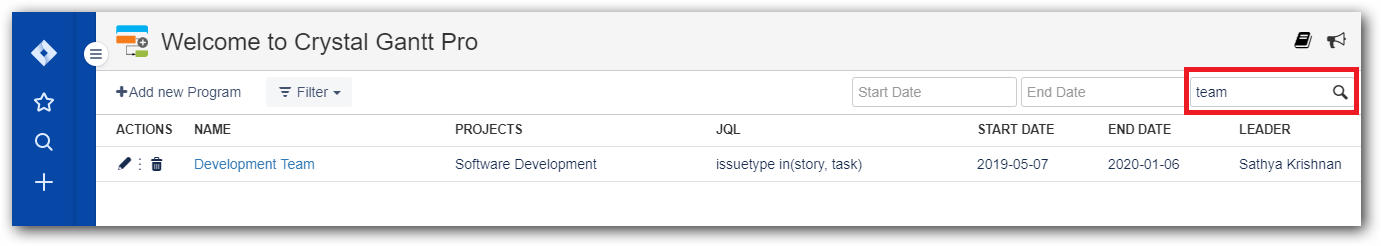
2. Gantt User Guide2.1 Gantt Data Display2.1.1 Gantt TaskbarTasks on our Gantt Chart is displayed in the form of Task Bars with a default color, whereas the parent task has a double-sided hook representation with a default color(black). When color by status is applied, regular tasks gets the color changed based on their status. When hovering task bar, a pop-up is displayed containing name, start, finish, duration, progress. 
2.1.2 Task ProgressCustom column for Progress Percent is available in Gantt whose value will be saved in both database and custom fields. They are represented by darker shade of taskbar's color. You can change this progress value in grid, Jira issue or by dragging the progress shade to the right within the taskbar. When a task status is changed to Done and has no children, then the value is set to 100%, else value will be calculated based on their children progress. .png?version=1&modificationDate=1559719651667&cacheVersion=1&api=v2&width=216)
Optionally, if you need this Progress field value to be calculated automatically, the icon helps you to update the Progress % of all the tasks in this Program (including the tasks that are hidden due to a filter) based on the task's Start and End Time and the Current Time. For example, if a task Start is Feb 1st and End is Feb 10th and current time is Feb 6th, then the Progress % for this task will be set to 50%. 2.1.3 Time Tracking ProgressWe calculate Time Tracking Progress based on the time tracking fields(Original and Remaining Estimate) value as specified by user in Jira issue. When a task status is changed to Done, then value is set to 100%, until then value is calculated based on their children time tracking progress. Time Tracking Progress = 100 - (100 * Remaining Estimate / Original Estimate) 2.1.4 MilestonesA milestone is a task with zero duration. It appears on the Gantt chart as milestone symbol(rectangular - diamond shape). Milestones are generally used to indicate important dates on the project plan, key events or goals. You can convert normal taskbar to milestone and vice versa using the taskbar context-menu. 
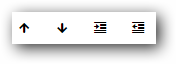
2.2 Structuring TasksThese commands let you structure the task's order, position, etc. within the Gantt: - Move Up - Moves the selected task one row up.
- Move Down - Moves the selected task one row down.
- Indent and Outdent - The parent-child relationship between adjacent tasks can be affected by indenting and outdenting them.
Note: - Tasks cannot be moved between multiple projects using move up/down.
- Sub-Tasks cannot be outdented from its parent task.
- Orphaned task (when the linked epic/parent is filtered out or not available) cannot be moved up/down, indented, outdented.
In Grid: - Indent - Makes this task as child of the previous one.
- Outdent - Makes this task a sibling of the previous one.
In Chart: - Milestone - Lets you switch a task type between Milestone and normal Task.
- Dependency - Delete/Change issue link type.
2.4 Color Tasks by StatusYou can get the tasks rendered with different colors based on their Status. Some statuses supported are: - Blue - ToDo
- Yellow - Pending
- Green - Completed
The Color by Status button lets you do this. 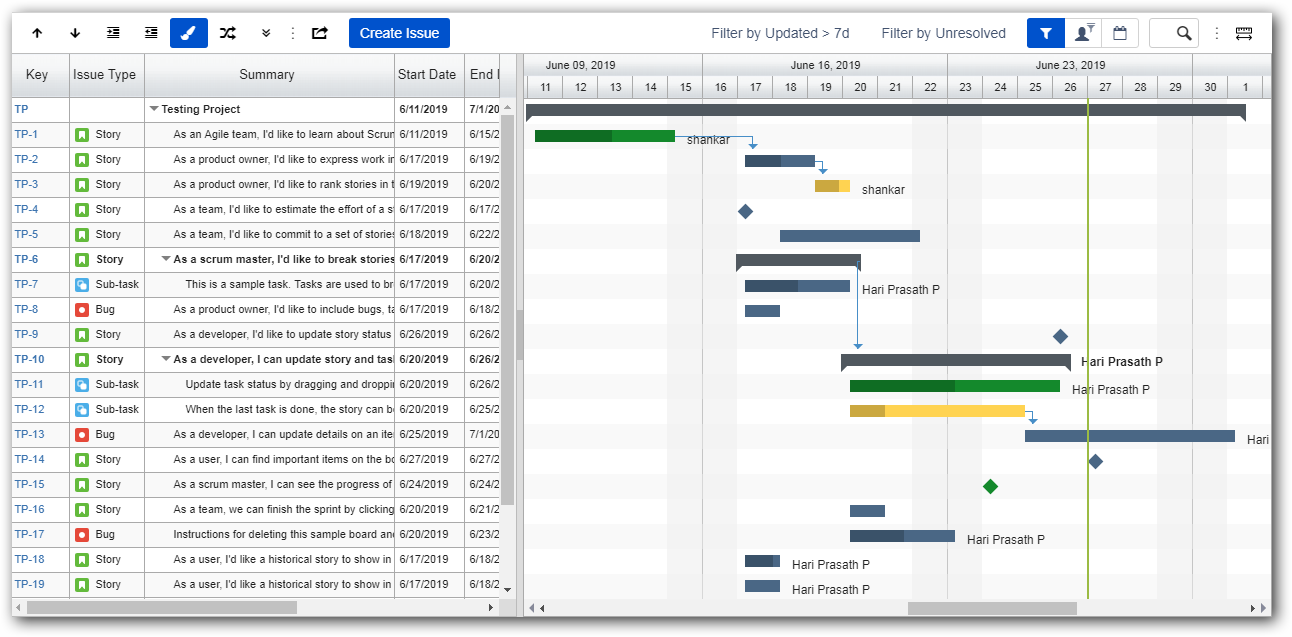
2.5 Critical PathA project's Critical Path is defined by a list of tasks whose delay will directly or indirectly affect the project's finish date. An activity could indirectly affect the project finish date because of the presence of dependencies that would in turn affect other activities move past the current project end time. It's often required to highlight such critical activities for proper project planning. You can highlight the cirtical path by clicking 'Color tasks based on critical path' icon. 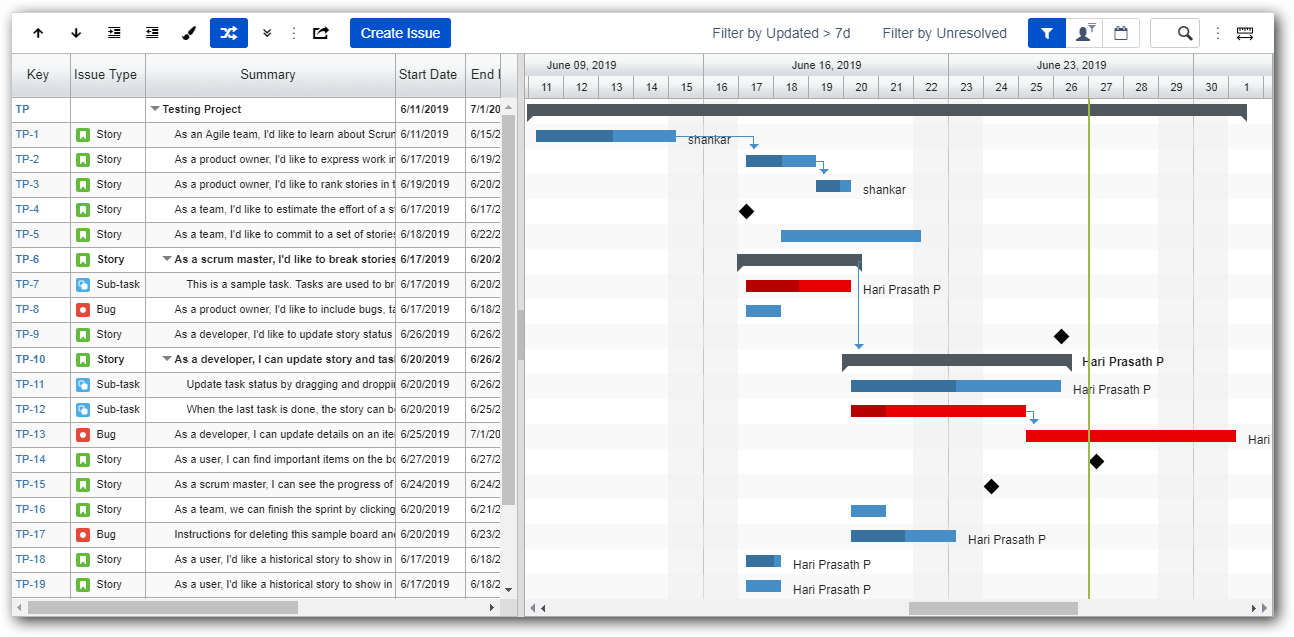
2.6 Expand/CollapseExpand/collapse all issues using these icon which gives a overview of whole program when it has multiple projects with more number of issues. 1.Expand  2.Collapse  2.7 ExportYou can export the Gantt in PDF or Excel format by clicking the below export icon from the toolbar. 
2.8 Linking TasksLinking tasks (by a simple mouse-drag connecting one task with another in the Chart area) creates a dependency between those two tasks making one a predecessor and the other a successor. You can setup these 4 kinds of link types that are introduced by Crystal Gantt into your Issue Linking configuration (refer Issue Link Configuration for more details), - Start-To-Start.
- Start-To-Finish.
- Finish-To-Start.
- Finish-To-Finish.
By default, when 2 tasks are linked in the Gantt, a Finish-To-Start link is setup. You can then delete/change link type using our dependency context menu. Once you link the tasks, every change you make to the predecessor affects the following successors. For example, you can connect a task CW-2 below to 2 other tasks making CW-2 the predecessor.

Then the links are represented like this in the task description: 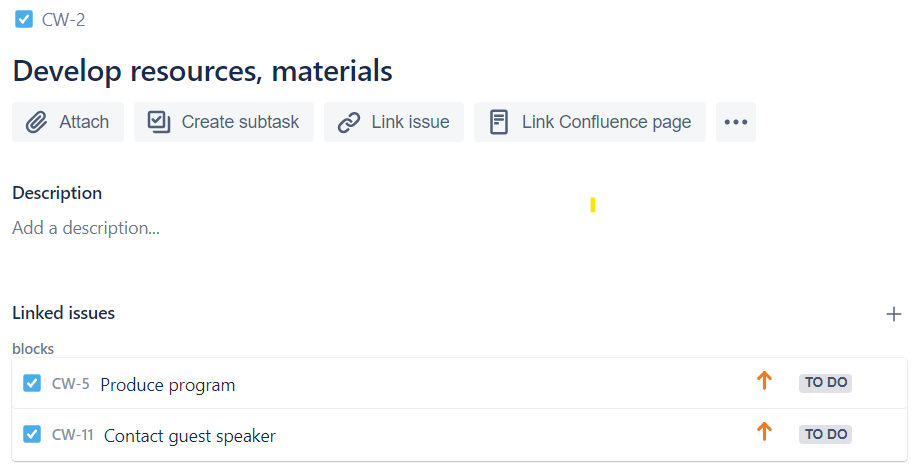
2.9 FilteringThe following filtering options are provided in the Gantt, - Quick filter
- Assignee filter
- Date range filter
Search box filter
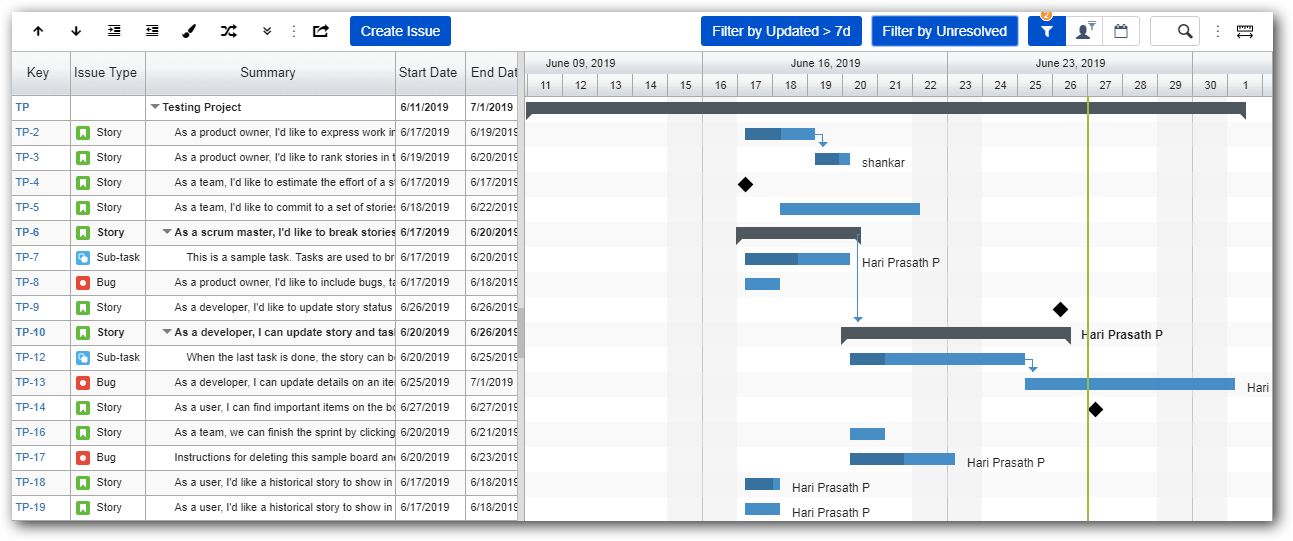
You can filter by more than one of these options. 2.9.1 Quick filterThere are 2 sub-options here: - Filter by Updated - loads gantt with tasks that has been updated within the past 7 days.
- Filter by Unresolved - loads gantt with tasks that are not resolved, having status ToDo, Open, Reopen, Testing and Backlog.
2.9.2 Assignee filterLoads gantt with tasks that are assigned to a specific user. Note: If a resource is not found, you will see an empty gantt. 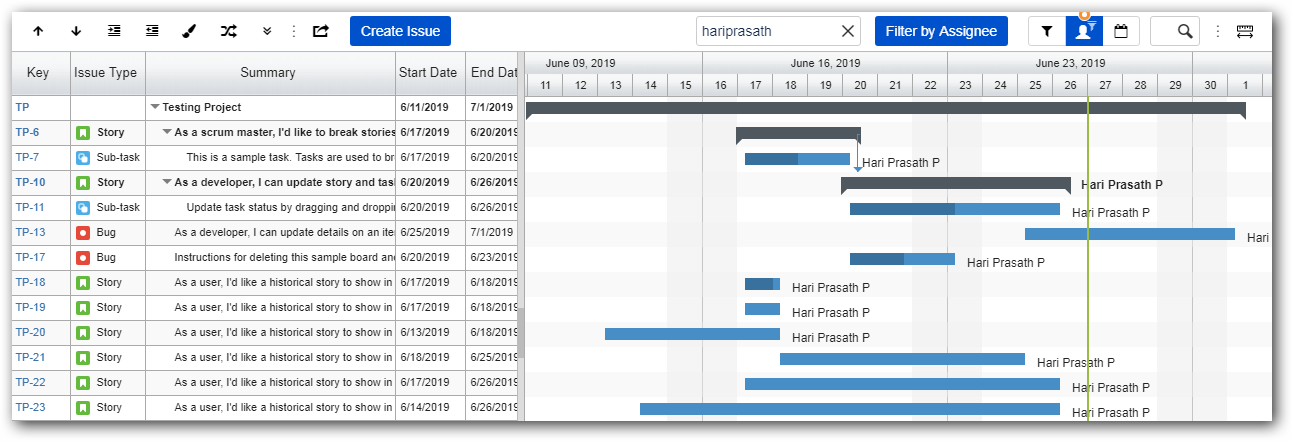
2.9.3 Date range filterLoads Gantt with tasks based on the specified start and end date range. Task times intersecting with this range will be displayed. 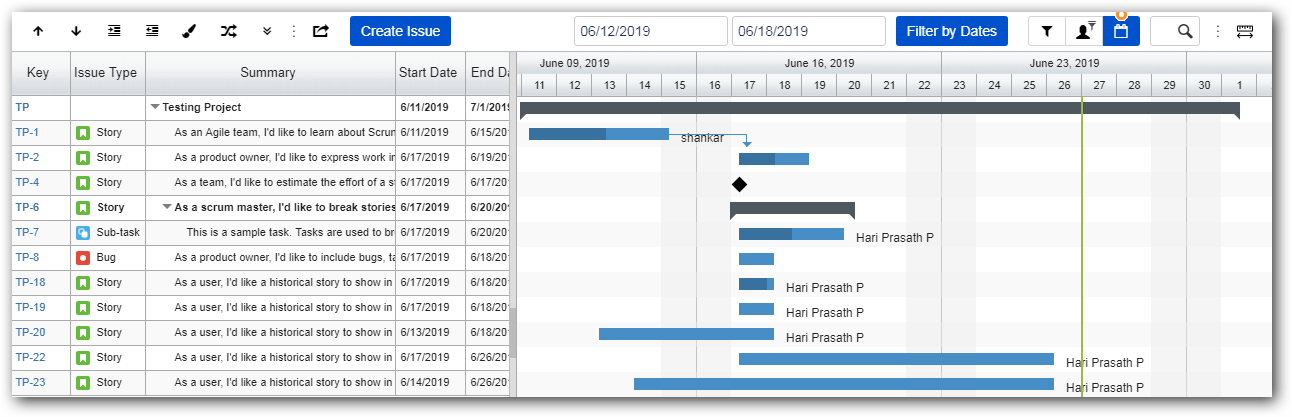
2.9.4 Search box filterAllows users to filter out the desired task and bring to view based on the keyword entered in search box. 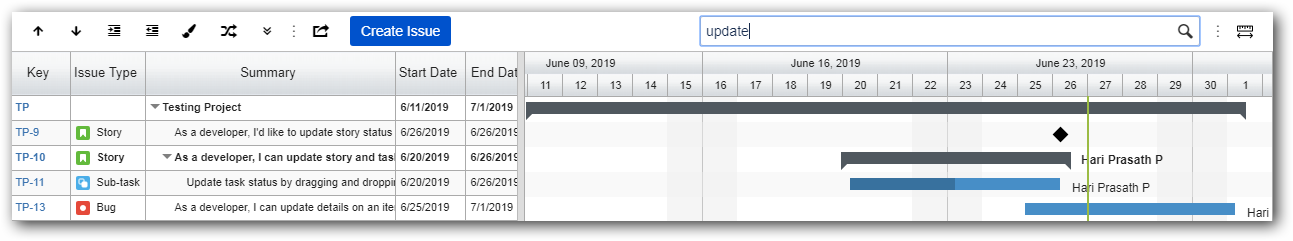
2.10 Gantt ScalingUsing this feature we can switch the Gantt chart header to a Day, a Week, a Month, or a Year. 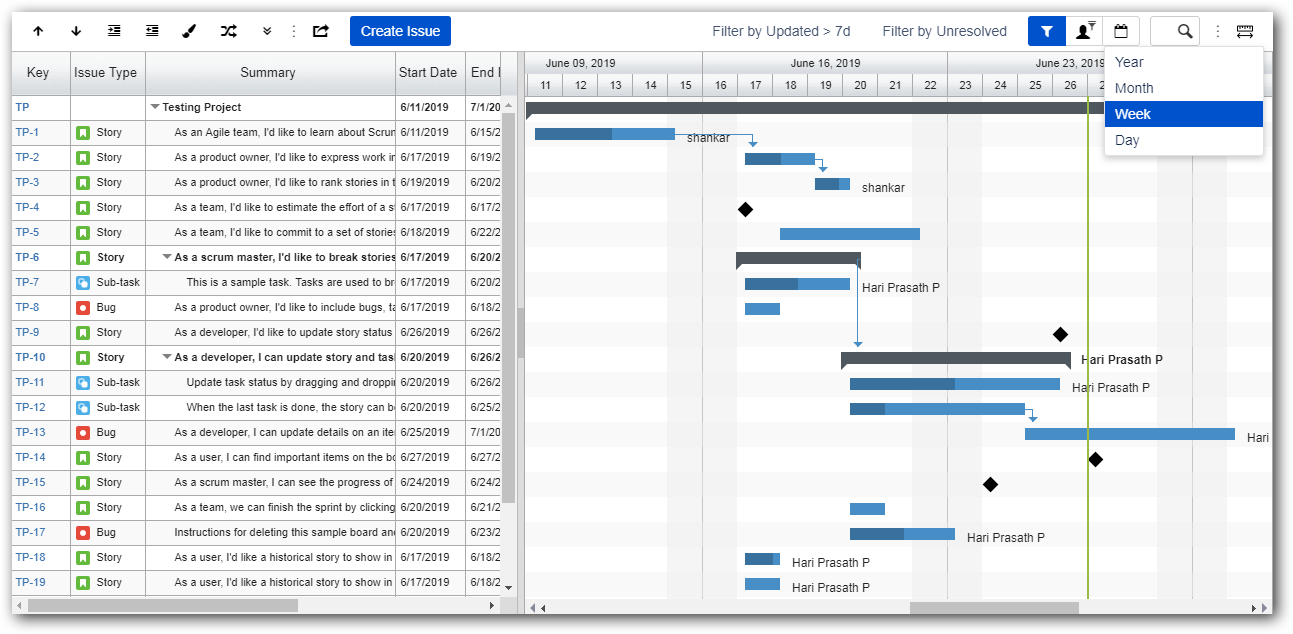
2.11 Creating IssueThe 'Create Issue' button when clicked, opens Jira's Create Issue dialog box. The newly created task will be automatically added to Gantt Chart and Jira Project. Note: When using multiple projects, choose the appropriate project in dropdown to create a issue for them. 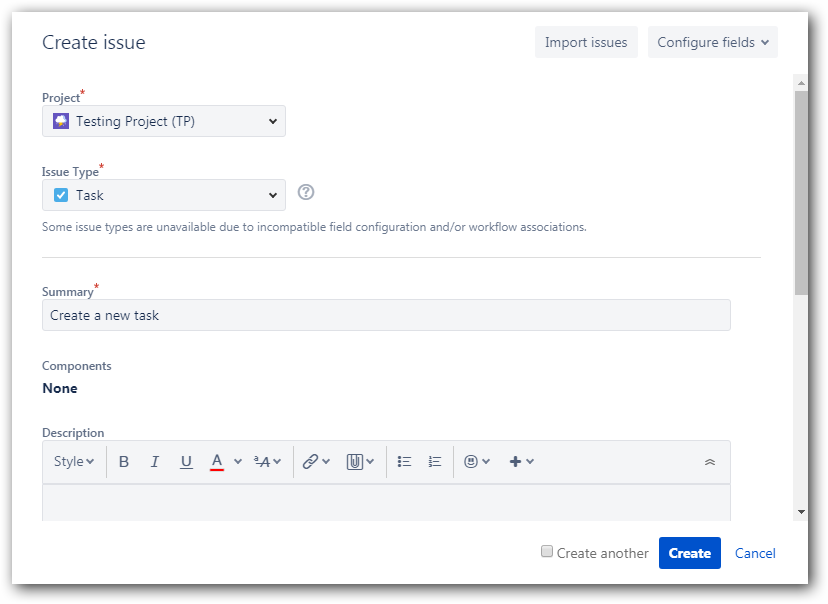
2.12 SaveChanges like summary name, assigning resource and issue links made in the Gantt will be saved immediately into JIRA. Changes in an issue's order, start/end date, indent level, progress percent will be saved immediately into CG Pro's database as well as optionally into Jira custom fields, if configured. 2.13 Resource Load ViewYou can get a overview of whole issues based on assigned users (Resource).

Switching to program page from Gantt using the back button. 
|